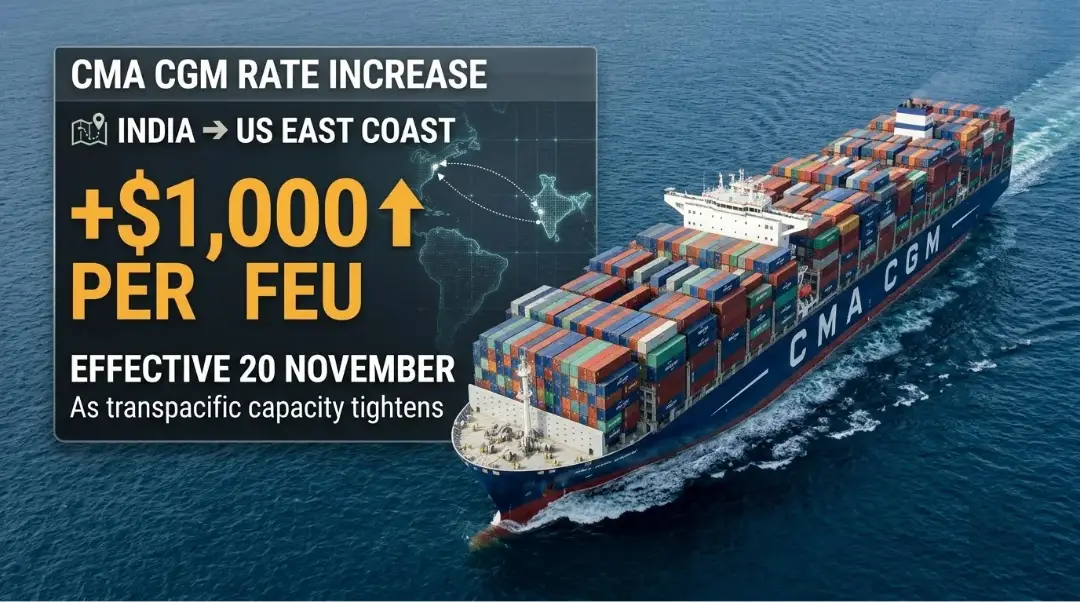
<p class="ds-markdown-paragraph" style="margin: 16px 0px; color: rgb(15, 17, 21); font-family: quote-cjk-patch, Inter, system-ui, -apple-system, BlinkMacSystemFont, "Segoe UI", Roboto, Oxygen, Ubuntu, Cantarell, "Open Sans", "Helvetica Neue", sans-serif; font-size: 16px;"><span class="">CMA CGM has notified customers of a general rate increase on the India–US East Coast trade lane, effective 20 November 2026, adding $500 per 20-foot container and $1,000 per 40-foot container to freight costs . The increase applies to all cargo types shipped from Indian ports to destinations on the US East Coast, and it represents a significant cost addition for Indian exporters using this corridor.</span></p><p class="ds-markdown-paragraph" style="margin: 16px 0px; color: rgb(15, 17, 21); font-family: quote-cjk-patch, Inter, system-ui, -apple-system, BlinkMacSystemFont, "Segoe UI", Roboto, Oxygen, Ubuntu, Cantarell, "Open Sans", "Helvetica Neue", sans-serif; font-size: 16px;"><span class="">The timing of the increase is notable because it diverges from the broader rate trend on major east-west routes. The Drewry World Container Index fell 2% to $4,305 per 40-foot container in the week to 12 November, with Shanghai–New York rates dropping 3% to $9,020 and Shanghai–Los Angeles falling 2% to $7,416 . Drewry attributed the decline to weak demand and improving capacity availability, and it projected further decreases </span><span class="">. The India–US East Coast increase runs counter to that direction, suggesting that the India-origin lane is experiencing capacity constraints or demand pressures that are not reflected in the China-origin benchmarks.</span><span class="_5f9bba8" data-citation-group="1" style="margin-left: 2px; margin-right: 2px;"><a href="https://www.worldports.org/world-container-index-12-november-2026/" target="_blank" rel="noreferrer" aria-label="11" style="color: rgb(57, 100, 254); transition: box-shadow 0.2s cubic-bezier(0.4, 0, 0.2, 1); border-color: rgba(255, 255, 255, 0); border-width: 2px 3px; margin-left: -3px; margin-right: -3px; text-decoration: none; position: relative;"></a></span></p><p class="ds-markdown-paragraph" style="margin: 16px 0px; color: rgb(15, 17, 21); font-family: quote-cjk-patch, Inter, system-ui, -apple-system, BlinkMacSystemFont, "Segoe UI", Roboto, Oxygen, Ubuntu, Cantarell, "Open Sans", "Helvetica Neue", sans-serif; font-size: 16px;"><span class="">The rate increase comes as Indian exporters continue to face elevated freight costs across multiple corridors. As we covered earlier, freight from Nhava Sheva to New York has risen from $1,800 to $12,000 per FEU since the start of the West Asia conflict, and the India–Gulf lane has seen even sharper increases . The CMA CGM adjustment adds another layer to the cost structure for exporters using US East Coast services, and it may prompt some shippers to reassess their routing or carrier selection.</span></p><p class="ds-markdown-paragraph" style="margin: 16px 0px; color: rgb(15, 17, 21); font-family: quote-cjk-patch, Inter, system-ui, -apple-system, BlinkMacSystemFont, "Segoe UI", Roboto, Oxygen, Ubuntu, Cantarell, "Open Sans", "Helvetica Neue", sans-serif; font-size: 16px;"><span class="">For Indian exporters of textiles, pharmaceuticals, engineering goods, and chemicals—the primary categories moving to the US East Coast—the increase represents a direct margin pressure. At a time when the government is targeting $1 trillion in total exports and October merchandise exports reached a record $49.47 billion, the cost of moving goods to the US market is a competitive variable that exporters cannot ignore. The increase may be absorbed by shippers, passed through to US buyers, or offset by efficiency gains elsewhere in the supply chain.</span></p><p class="ds-markdown-paragraph" style="margin: 16px 0px; color: rgb(15, 17, 21); font-family: quote-cjk-patch, Inter, system-ui, -apple-system, BlinkMacSystemFont, "Segoe UI", Roboto, Oxygen, Ubuntu, Cantarell, "Open Sans", "Helvetica Neue", sans-serif; font-size: 16px;"><span class="">The broader context for the increase is the ongoing volatility in transpacific capacity. Drewry noted that carriers are managing capacity through blank sailings, with eight blank sailings announced for the following week on the transpacific, and congestion at Shanghai increased to 49 hours from 36 hours the previous week, reversing an 11-week easing trend </span><span class="">. While the India–US East Coast lane is not directly affected by Shanghai congestion, the global capacity picture influences carrier deployment decisions and rate-setting across all transpacific services.</span><span class="_5f9bba8" data-citation-group="2" style="margin-left: 2px; margin-right: 2px;"><a href="https://www.worldports.org/world-container-index-12-november-2026/" target="_blank" rel="noreferrer" aria-label="11" style="color: rgb(57, 100, 254); transition: box-shadow 0.2s cubic-bezier(0.4, 0, 0.2, 1); border-color: rgba(255, 255, 255, 0); border-width: 2px 3px; margin-left: -3px; margin-right: -3px; text-decoration: none; position: relative;"></a></span></p><p class="ds-markdown-paragraph" style="margin: 16px 0px; color: rgb(15, 17, 21); font-family: quote-cjk-patch, Inter, system-ui, -apple-system, BlinkMacSystemFont, "Segoe UI", Roboto, Oxygen, Ubuntu, Cantarell, "Open Sans", "Helvetica Neue", sans-serif; font-size: 16px;"><span class="">Looking ahead, the key question is whether the CMA CGM increase will be followed by other carriers on the India–US East Coast lane, and whether it will hold or be eroded by competitive pressure. The increase is effective from 20 November, and its impact will become visible in freight bookings and shipper behaviour in the following weeks. For now, the adjustment signals that the India–US corridor remains a tight market, even as the broader east-west trades show signs of softening.</span></p>
CMA CGM Raises India–US East Coast Rates by Up to $1,000 per FEU from 20 November as Transpacific Capacity Tightens
CMA CGM has announced a general rate increase on shipments from India to the US East Coast, effective 20 November 2026, with increases of $500 per 20-foot container and $1,000 per 40-foot container. The surcharge applies to all cargo types moving from Indian ports to US East Coast destinations. The increase comes as the Drewry World Container Index declined 2% to $4,305 per FEU, with transpacific rates falling to their lowest levels since August, suggesting the India–US lane is diverging from the broader east-west rate trend.